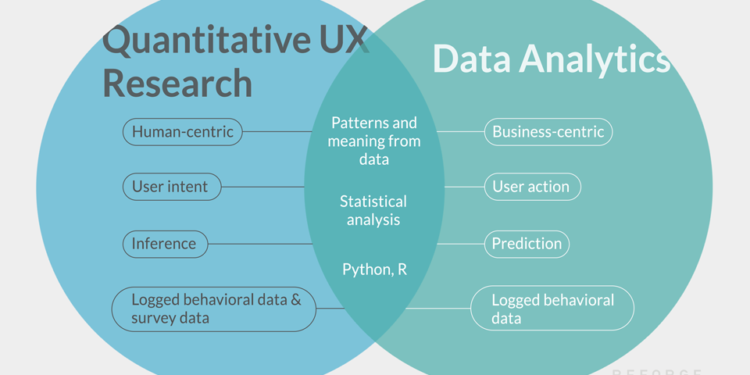
Quantitative data may sound intimidating at first, reminding of the math classes you used to have at school. We won’t say that it’s not that hard; in fact, it may be complicated to collect and make sense of numbers for laypersons. Still, a UX designer shouldn’t be afraid of quantitative work because it is the basis for wise, well-grounded UX solutions.
Thus, when hiring a UX design company, make sure they have a UX researcher with in-depth understanding of quantitative research methods on board. Such an expert can design, implement, and analyze a quantitative study to find out the right UX solutions for your digital project. But first, let’s find out what quantitative research is and what tools exist to make UX researchers’ lives easier.
Intro to Quantitative Research
In a nutshell, quantitative studies are the ones that use figures as the primary material for analysis. unlike qualitative interviews or focus groups, solid figures don’t stand varying interpretations, so their analysis is much less subjective.
If we dig a bit deeper into science, we’ll see that qualitative and quantitative research approaches reflect two distinct visions of the surrounding reality.
- Qualitative researchers hold a symbolic interactionist view of the world, thinking that there is no uniform reality, and our perceptions and lived experiences shape it.
- Quantitative researchers are positivists who believe that there is a single, objective reality that can be measured with figures.
Thus, if you want to work on the UX design by considering individual users’ subjective perspectives, you can benefit from qualitative studies. If you want to serve larger populations and base your UX decisions on more or less objective data, quantitative studies will become your reliable work companion.
Quantitative Research Methods in UX
As a UX researcher, you may try several quantitative methods to see which one suits your project needs and goals the best.
#1 Funnel Analysis
Your digital product’s sales funnel is a sequence of steps that bring a prospect from an initial acquaintance with your product to an actual purchase or subscription. if you see that the product under-performs, it’s time to analyze the sales funnel stages and see where the major portion of bounce occurs. Look at the figures, detect the problematic step, and make UX changes to attract more users without friction.
#2 A/B Testing
A/B testing of two UX design variants is a great way to choose one variant based on solid user approval. However, A/B testing may go much far beyond a simple “yes/no” answer. Let your users evaluate various dimensions of the offered variants; this way, you can get a more nuanced quantitative snapshot of features they like most and least in both options. These findings can lay the basis of A/B versions’ combination to achieve maximal user buy-in.
#3 Heatmaps
A heatmap is an excellent visual display of your visitors’ attention peaks. Such maps provide a clear glance at what visual elements are paid maximum attention to, and which ones remain overlooked and ignored by the users. Remove the redundant features and focus on the popular ones – it’s a magical formula of UX design.
#4 Cohort Analysis
Analysis of cohorts is an excellent way to see whether you’ve identified your target audience correctly. The cohorts are the population categories with distinct characteristics. So, by looking at the cohort using your app the most and the least, you can realize what’s wrong with your UX design solutions. Singling out separate cohorts may also help with UX design’s personalization.
#5 Metrics Analysis
You can take a 3600 view of your product’s performance by looking at some popular analytics, like Google Analytics. These sources give precise evaluations of the key business metrics, such as your bounce and conversion rate, page views, and click-throughs. Based on this data (it’s better to compare several different UX designs), you will see which design solution works better and which fails to deliver the expected results.
Credit: Codigos De Paises
Quantitative Research Software
Now that we know what methods you can use to approach UX design quantitatively, it’s time to take a look at what the present-day software market offers. Experienced UX designers recommend the following apps and programs specifically tailored to quantitative UX research needs.
#1 Smartlook
This universal tool can give you both quantitative and qualitative insights into user preferences and behavior. It can provide concise metrics on specific user interactions, like URL visits, in-app purchases, along with in-depth web and mobile analytics. A useful feature is a session replay, which allows you to take a virtual tour over each visitor’s on-site or in-app session, seeing all actions they’ve taken and buttons they’ve clicked on.
#2 Maze
Maze is a highly affordable and helpful tool for IA testing, remote testing, and holding surveys with users. It generates real-time reports and contains many collaboration features for empowering your UX researcher’s teamwork with other project participants. Maze also offers many handy pre-built templates to simplify data visualization. Pricing plans start at $25 per month.
#3 Userzoom
If you’re looking for an all-in-one tool for UX research, Userzoom is definitely worth trying out. It comes with all kinds of usability testing features, interviews, surveys, and intercept testing. You can quickly set up a click testing and tree testing procedure in it. The tool will also help with participant recruiting and card sorting, offering end-to-end assistance with UX.
#4 Ribbon
Ribbon is much more than your regular quantitative UX research tool. The software was created to expand the outreach of UX researchers, so it includes convenient interview scheduling and participant recruitment features. You may also enjoy numerous screeners tracking your quantitative metrics and an incentive management toolkit.
#5 Hotjar
One of the most accessible UX research products (pricing plans start at $39 per month), Hotjar is a great assistant in quantitative UX analysis. It provides the whole set of features you would need, including heatmaps, screen recordings with user journeys, follow-up surveys, and a whole lot of other instruments making your UX research a breeze.
Figures Can Empower Your UX Decisions
As you can see, quantitative research offers a rich and powerful set of instruments for UX decision-making. It’s a workable approach to UX design that helps you assess large populations’ use patterns and preferences, thus coming up with a universal solution for the selected target group.


